
Every once in a while I stumble upon a new interesting nugget of information about the past climate here in the Great Lakes. And it sometimes leads me to question just how well we understand the magnitude of the climate change that has already occurred. As I’m typing this blog, it’s another hot September day. Most places here in the Buckeye State have struggled to drop below 50 so far this month. Overnight record lows are in the low to mid 20s in outlying locations this time of the year – certainly haven’t been near those values! Even normal lows are now into the middle 40s, and will drop even further before the end of the month. As I’ve posted in the past, patchy frosts used to occur even in July in the distant past – at least in northern parts of the Buckeye State!
But this chart is really astounding. Below I’ve posted a graphic showing the average (arithmetic mean) yearly low temperature as recorded in Lansing, Michigan from 1864-2015. What stands out is just how much the overnight minima have risen throughout the years. In the 1860s and 1870s, there was a lengthy period were they were always in the upper 20s and lower 30s. In recent years, the average has been in the mid and upper 30s, with warmer years exceeding 40. Most remarkable is the value from 1868, when the mean low temperature was just 27.9F. To put this into perspective, Duluth International Airport has not seen a yearly low temperature that cold since 1996. Duluth! Hundreds of miles north of Lansing. And at the airport, no less! DLH has an elevation of around 1,427 feet. Lansing, MI is roughly 860 feet. Simply incredible. And while some of the warming at Lansing may be attributable to land use changes, or so-called “urban” warming, it’s clear that DLH is not exactly an urban heat island. Even the Marquette NWS Office in Negaunee, Michigan (elevation approximately 1371′) barely had a mean minimum temperature lower than that during the recent cold year of 2014. It’s incredible to think just how much the climate has changed just since the mid-19th Century. And the speed of these changes should only increase as time goes on.
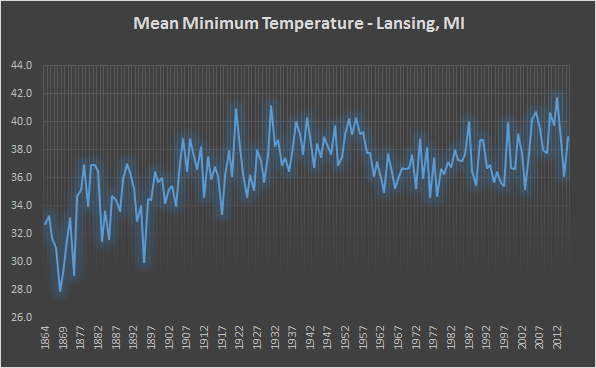
Figure 1. Average (arithmetic mean) annual low temperature recorded in Lansing, Michigan. Note the apparent slow-down (or modest reversal) in the long-term warming trend in the mid-1950s could be an artifact in the data. It is around that time when the official recording station was moved from the Michigan State campus in East Lansing to its current location at the airport (ICAO: KLAN).
