Comparing Lake Erie Temperatures to Surface Air Temperatures (1927-2016)

A common criticism of the temperature records are that they are greatly affected by the urban heat island effect. Now, the urban heat island effect is a real phenomenom; however, the extent to which it is affecting global climate changes is negligible. The vast majority of the earth is comprised of water (oceans). And a good deal of the land mass is still rural. But even in urbanized areas, the extent to which the observed changes can be ascribed to urban heat is limited. The trend is only going to be affected if there’s been a large and noticeable change in the land use and prevailing character of the terrain. A station sited in an urban area may show warmer temperatures than surrounding suburban or rural locations, but the overall trend should not be greatly affected unless there’s been a real change in the urban character of the surroundings.

Below is a comparison of the Lake Erie water temperatures measured off the coast of Buffalo, NY (approximately 30-35′ below the water’s surface) with the air temperatures measured at Buffalo. The data shown below are for the period January 1 through September 23, in order to allow 2016 to be accurately depicted. I will issue an update at the end of the year. There’s a remarkable correlation between the two. In fact, of the ten warmest water temperature years, all but one (1953) also appear among the ten warmest air temperature years. Likewise, of the ten warmest air temperature years, all but one (1955) appear among the ten warmest water temperature years. 2012 is #1 for both categories. The overall trend in air temperature is +0.188F per decade for the period 1927 to the present, and the overall trend in water temperature is +0.165F per decade over the same interval. The slightly greater trend in air temperature should not be surprising considering the higher heat capacity of water versus air (in fact, it is to be expected). Thus, using the observed change in water temperature, one can pretty much confirm that the trend in air temperature is a real phenomenom (and not an artifact of the data).

To date, 2016 has had the 2nd warmest observed water temperature (mean: 54.0F) and the 3rd warmest air temperature (mean: 53.6F).

lake-erie-water-temps

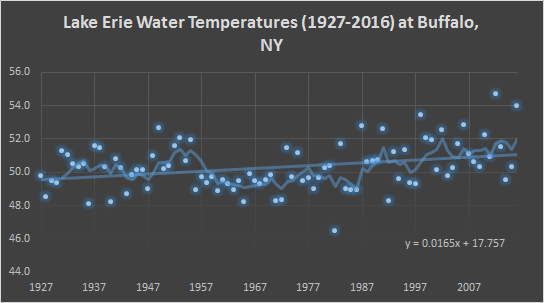
Figure 1. Lake Erie water temperatures at Buffalo, NY for the period January 1 through September 24 (1927-2016).

mean-air-temps

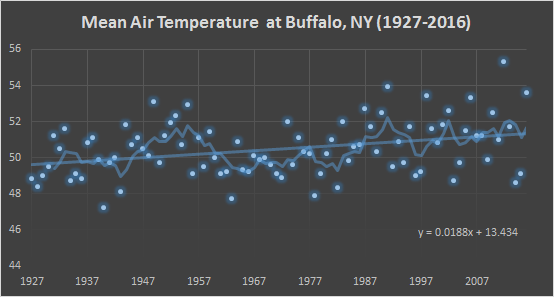
Figure 2. Mean air temperatures at Buffalo, NY for the period January 1 through September 24 (1927-2016).

Ten Warmest Lake Temps, Buffalo (1/1 – 9/24)

  1. 2012 54.7F
  2. 2016 54.0
  3. 1998 53.5
  4. 2006 52.8
  5. 1987 52.8
  6. 1949 52.7
  7. 1991 52.6
  8. 2002 52.5
  9. 2010 52.2
  10. 1953 52.1

Ten Warmest Air Temps, Buffalo (1/1-9/23)

  1. 2012 55.3F
  2. 1991 53.9
  3. 2016 53.6
  4. 1998 53.4
  5. 2006 53.3
  6. 1949 53.1
  7. 1955 52.9
  8. 1987 52.7
  9. 2002 52.6
  10. 2010 52.5

Just how much has it warmed?

Every once in a while I stumble upon a new interesting nugget of information about the past climate here in the Great Lakes. And it sometimes leads me to question just how well we understand the magnitude of the climate change that has already occurred. As I’m typing this blog, it’s another hot September day. Most places here in the Buckeye State have struggled to drop below 50 so far this month. Overnight record lows are in the low to mid 20s in outlying locations this time of the year – certainly haven’t been near those values! Even normal lows are now into the middle 40s, and will drop even further before the end of the month. As I’ve posted in the past, patchy frosts used to occur even in July in the distant past – at least in northern parts of the Buckeye State!

Continue reading Just how much has it warmed?

2016 so far (cont.) – Regional view

Earlier today, I published a post about Cleveland’s warm start to 2016. Through September 11th, this has been the 3rd warmest year on record at Cleveland. This post is a continuation of that theme, but with some other state and regional airports (including threaded records). Like at Cleveland, most other places in the region are well in the top ten warmest to date.

Continue reading 2016 so far (cont.) – Regional view

2016 so far – 3rd warmest start to year on record

I recently shared some interesting numbers regarding the summer of 2016’s record-breaking heat in Cleveland and northern Ohio. Today, I figured I’d briefly look at where we are for the year to date. The mean temperature for the period January 1 through September 11, 2016 has been 55.9 degrees, which ties with 1921 as the 3rd hottest such period on record. The hottest such period occurred in 2012, with a mean temp. of 57.5F – a full 1.6F warmer than the present year. Second place occurred in 2010 with a mean temp. of 56.0F, just 0.1F warmer than this year. As can be seen from the data, there is a clear trend towards warming in recent years.

Continue reading 2016 so far – 3rd warmest start to year on record

July and August 2016 among hottest on record

In a previous post, I noted that this past summer was the hottest on record in Cleveland. In the post, I take a closer look at the months of July and August. July 2016 tied 1921 for sixth hottest on my expanded dataset (1855-present). Note the official records which date only to 1871 show this month as fifth hottest. August 2016 was the hottest on record with a mean temperature of 77.8F, ending in a statistical tie with both 1995 and 1947. July temperatures have been warming at a rate of 0.8F per century, and August temperatures have been warming at a rate of 1.4F per century. However, these data are not corrected for any sort of site or instrumentation changes. Due to a number of factors, the actual warming trend over that period is probably slightly more than implied by the data alone.

Continue reading July and August 2016 among hottest on record

Update – Meteorological Summer of 2016 confirmed to be hottest on record

As I alluded to earlier last month, this past summer was on track to be one of the hottest on record. Well, after a very warm August, the final numbers are in… And 2016 did indeed take home the #1 spot in Cleveland with a mean temperature of 75.5F. According to my expanded dataset, the top ten hottest summers (1855-present) are as follows:

  1. 2016 75.5F
  2. 1949 75.0F
  3. 1995 74.9F
  4. 2010 74.4F
  5. 1955 74.4F
  6. 2005 74.3F
  7. 2012 73.9F
  8. 1952 73.9F
  9. 1944 73.5F
  10. 2011 73.3F

Summer Temps 1855-2016.png


Figure 1: Chart showing annual mean summertime temperatures (June 1-August 31) as recorded in Cleveland, Ohio for the period 1855 to the present.

In addition, many other locations in the region with log periods of record also recorded record (or near record) warmth this past summer.

Continue reading Update – Meteorological Summer of 2016 confirmed to be hottest on record

Summer 2016 – Hottest on record?

It’s been awhile since I made a new blog post, so I decided to post a quick update on the current summer. This has been a very hot and dry summer f0r Cleveland and, indeed, for all of northern Ohio and many of the adjacent Great Lakes states. Meteorological summer is typically defined as the period from June 1 through August 31 – this period is used because it roughly corresponds to the hottest three month period, and it’s more convenient for sharing climate info than relying on astronomical seasons which begin and end in the midst of months.

For the period June 1, 2016 through Friday, August 5, 2016, the mean temperature at Cleveland has been a remarkably warm 74.8F. To put this number in perspective, I have included a chart of the final summer readings for every year from 1855 through 2015 in Cleveland, Ohio (see Figure 1 below). If the season were to end today, this would be the third hottest meteorological summer behind 1995 (74.9F) and 1949 (75.0F). Obviously, there is still quite a bit of the month of August remaining; however, current indications are for the warm weather to persist for most of the next two weeks.

Summer Temps 1855-2016.png

Figure 1. Mean summertime temperatures in Cleveland, Ohio for the period 1855 through 2015.

Continue reading Summer 2016 – Hottest on record?

Late May Snow Storms of 1883 and 1894

According to the Report of the Ohio Meteorological Bureau for the Month of May 1883, a significant snowfall occurred in parts of the state on the 21st and 22nd. The report states:

“A heavy fall of snow occurred on the 21st in the north-western parts of the State. Snow is reported on that date from Dayton, Sidney, Lima, Upper Sandusky, Wauseon, Lebanon, Westerville and Columbus. The greatest depth was 15.5 inches at Lima. At Wauseon, the depth was 6.5 inches, at Sidney 7 inches, at Dayton 2 inches, and at Upper Sandusky 3 inches. At other stations the amount was small. Notwithstanding the depth of the snow and the great area covered by the storm, so far as has been ascertained no particular damage to vegetation resulted from it. One of our observes, Mr. G. A. Hyde, of Cleveland, who has kept a meteorological record for many years, reports that he has recorded but three snow-storms in May during the last 28 years. These were on May 1st, 1861, one-tenth of an inch, May 2nd, 1869, two-tenths of an inch, and May 1st, 1877, three-tenths of an inch.”

Continue reading Late May Snow Storms of 1883 and 1894

The Great Snowstorm of April 19-21, 1901

It’s been awhile since I’ve made a blog post, but today I’ve awoke my slumber to share some information and pictures pertaining to the significant snowfall in eastern Ohio between April 19th and 21st, 1901. This storm was unprecedented in its ferocity for so late in the season, and is still unmatched in terms of April snowfall. Indeed, the snowfall totals that occurred have rarely been noted in the state of Ohio at any time of the year. Given the warming climate, it would seem unlikely that an event of similar magnitude could ever reoccur at this time of the year — which is all the more reason to save this one for posterity.

Below is a contour map showing a rough distribution of the snowfall, in inches, from this event. Note that much of the eastern half of the state saw more than a foot, with local totals in excess of 36″.

Contour map showing snowfall accumulations during the storm of April 19-21, 1901.

Continue reading The Great Snowstorm of April 19-21, 1901

Cleveland climate history update (1854-2012)

Annual temperature (1855-2012)

2012 was the warmest year on record at Cleveland, since continuous records began in April 1855. The mean annual temperature was 54.0F, which was 0.5F warmer than the previous record warm year during the 1998.  The 1998 heat spike was associated with an unusually strong El Nino event that lead to a pronounced warming throughout much of the Northern Hemisphere. The unusual warmth experienced in 2012 was associated primarily with the enhanced greenhouse effect, as atmospheric CO2 concentrations reached at or above 400 ppm in much of the Northern Hemisphere during the spring of 2013.

Continue reading Cleveland climate history update (1854-2012)